Wind Map (2018): for orchestra
Sam Wu
1781
10:10
Nov 13, 2018
20
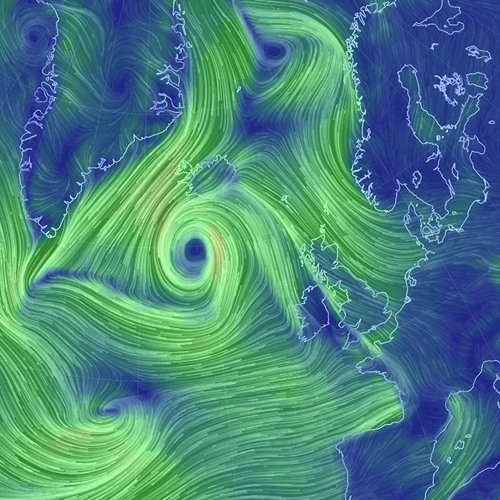
The graphic above is a visualization of global wind patterns; massive amounts of weather data are fed into a supercomputer that then produces a live (or pseudo-live) “wind map.” The swirls and swoops are color-coded: are…